Know your racks are cool. Before they aren't.
Self-hosted thermal & SNMP monitoring for server rooms, colocation and edge sites — live rack heatmaps, alerts that don't cry wolf, SLA reports and a public status page. On your own box, in minutes.
Everything to keep a room from cooking itself.
Not a framework to assemble — a finished monitor. Real screenshots, no mockups.
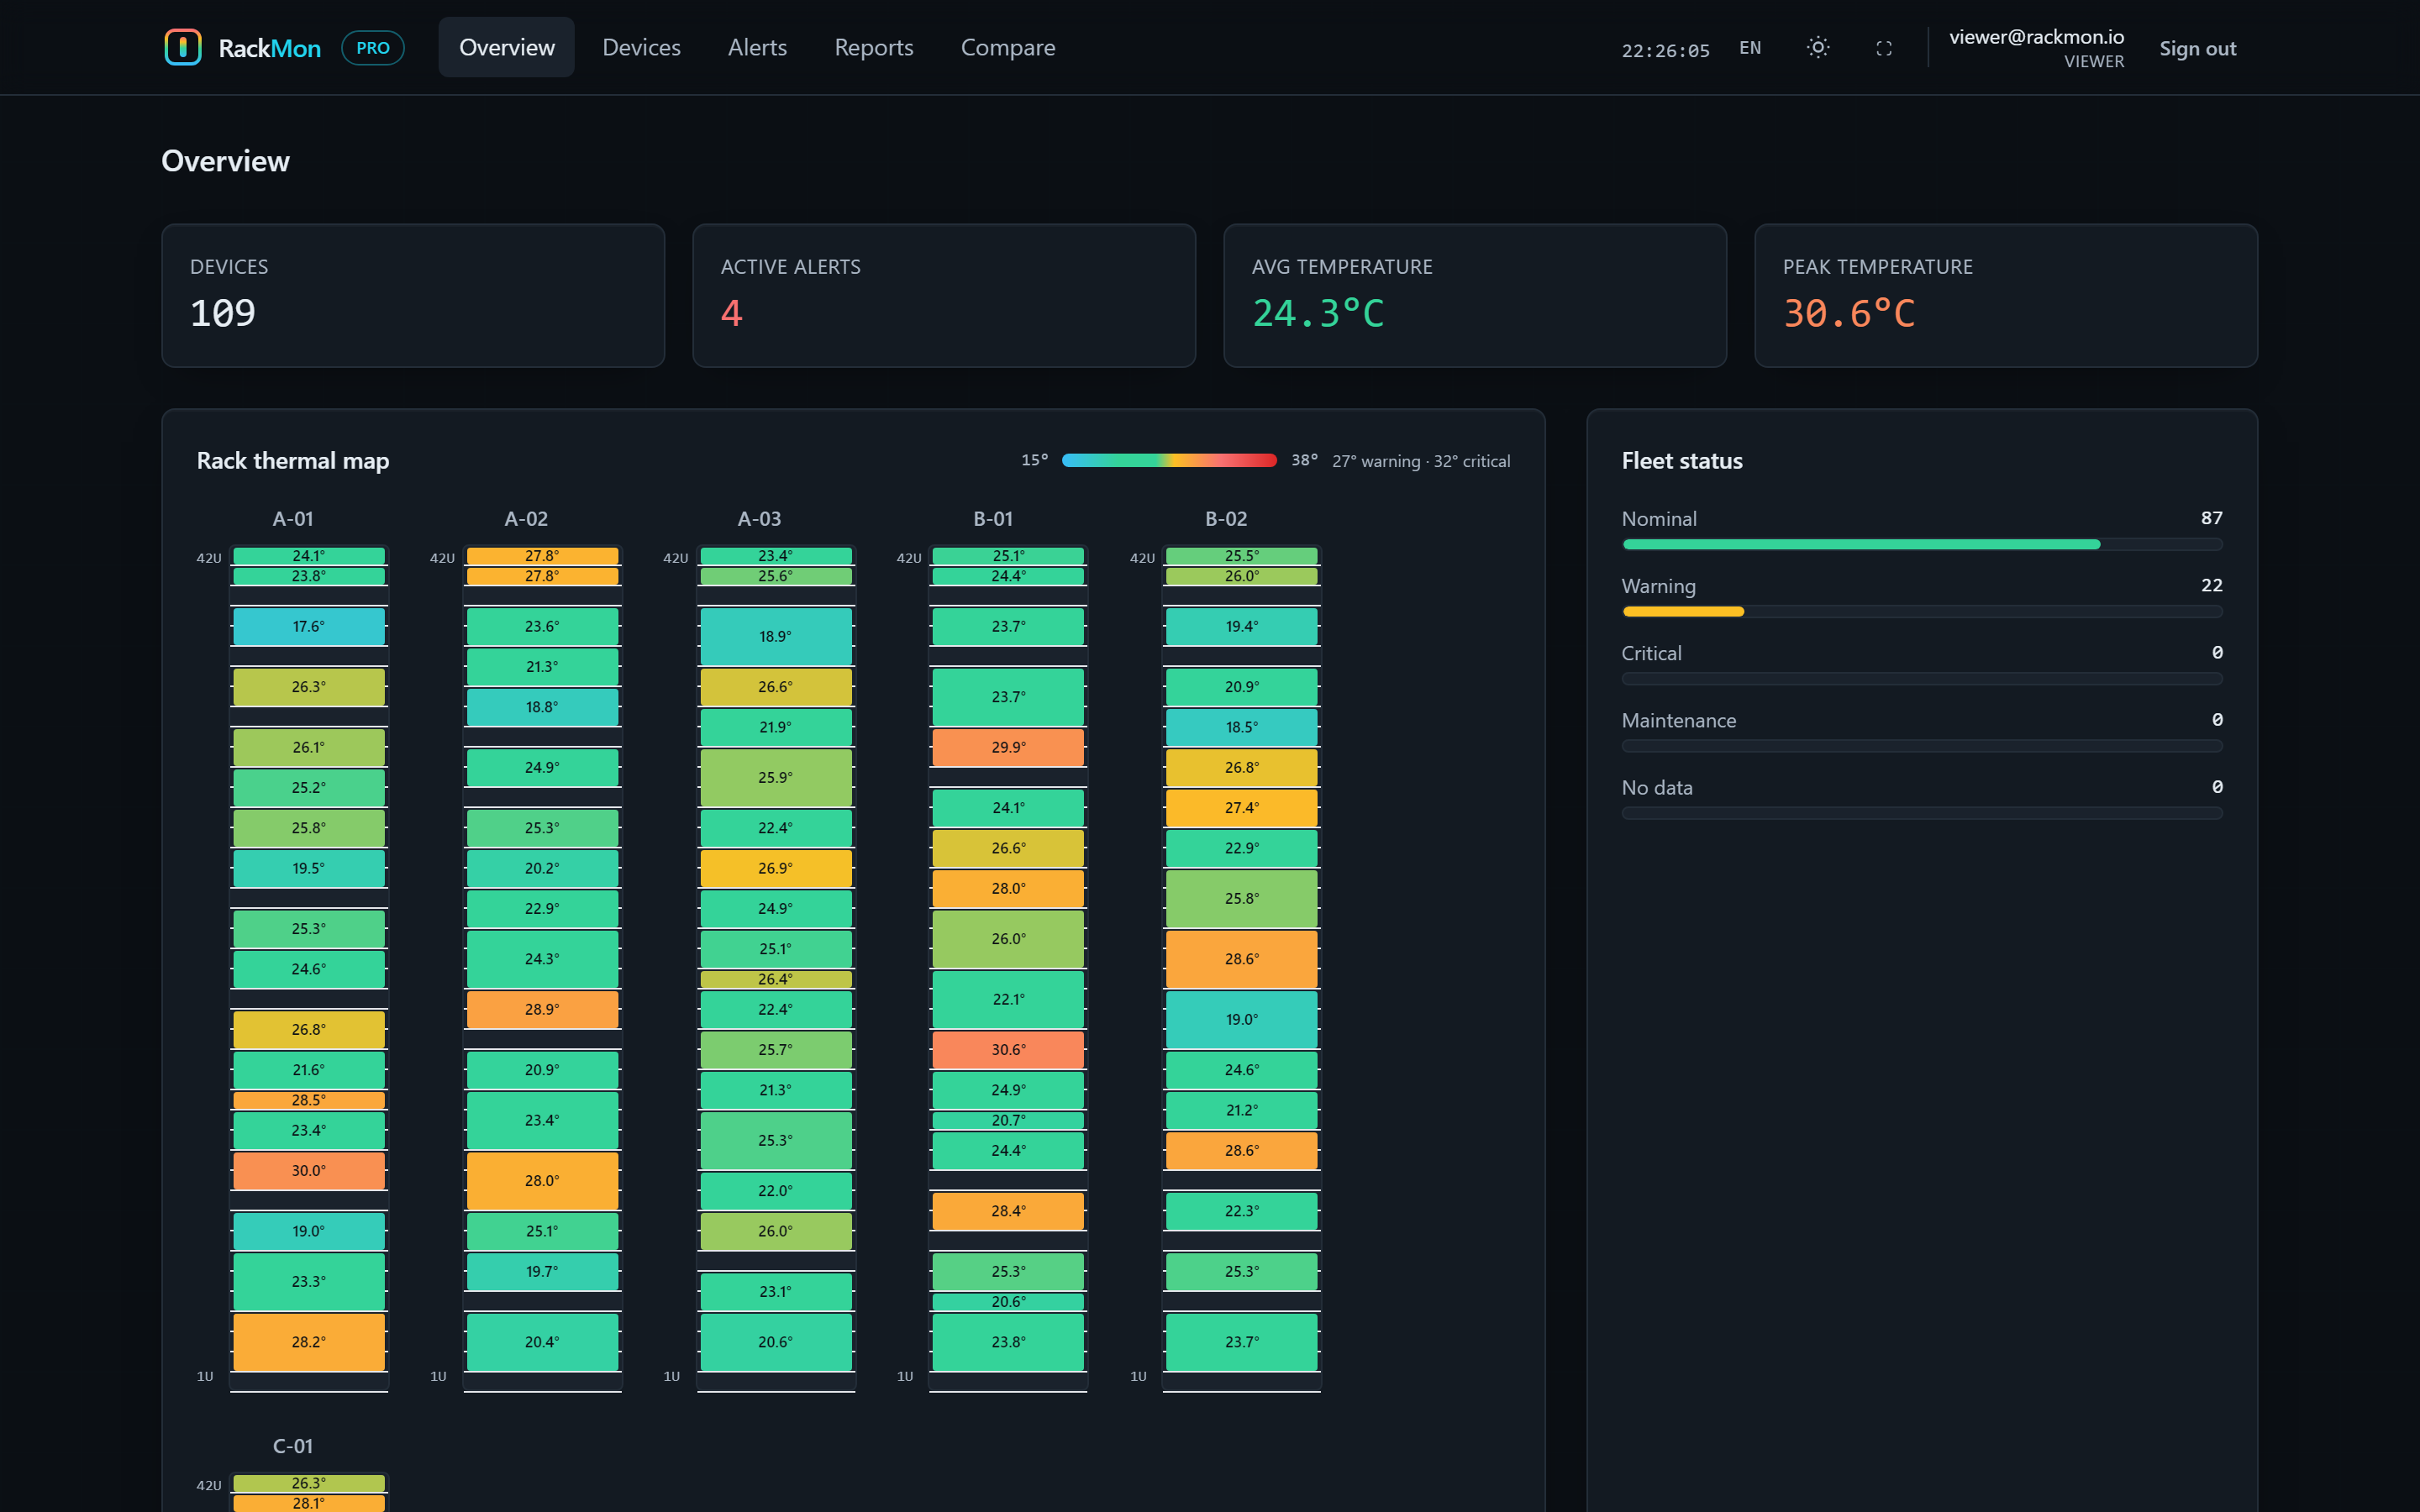
A rack you can read at a glance.
Every rack rendered U-by-U and colored by temperature. The hot node is obvious — no graphs to assemble, no queries to write.
- Per-U thermal map for every rack
- Fleet roll-up: nominal / warning / critical
- Average and peak temperature up top
Telemetry with teeth.
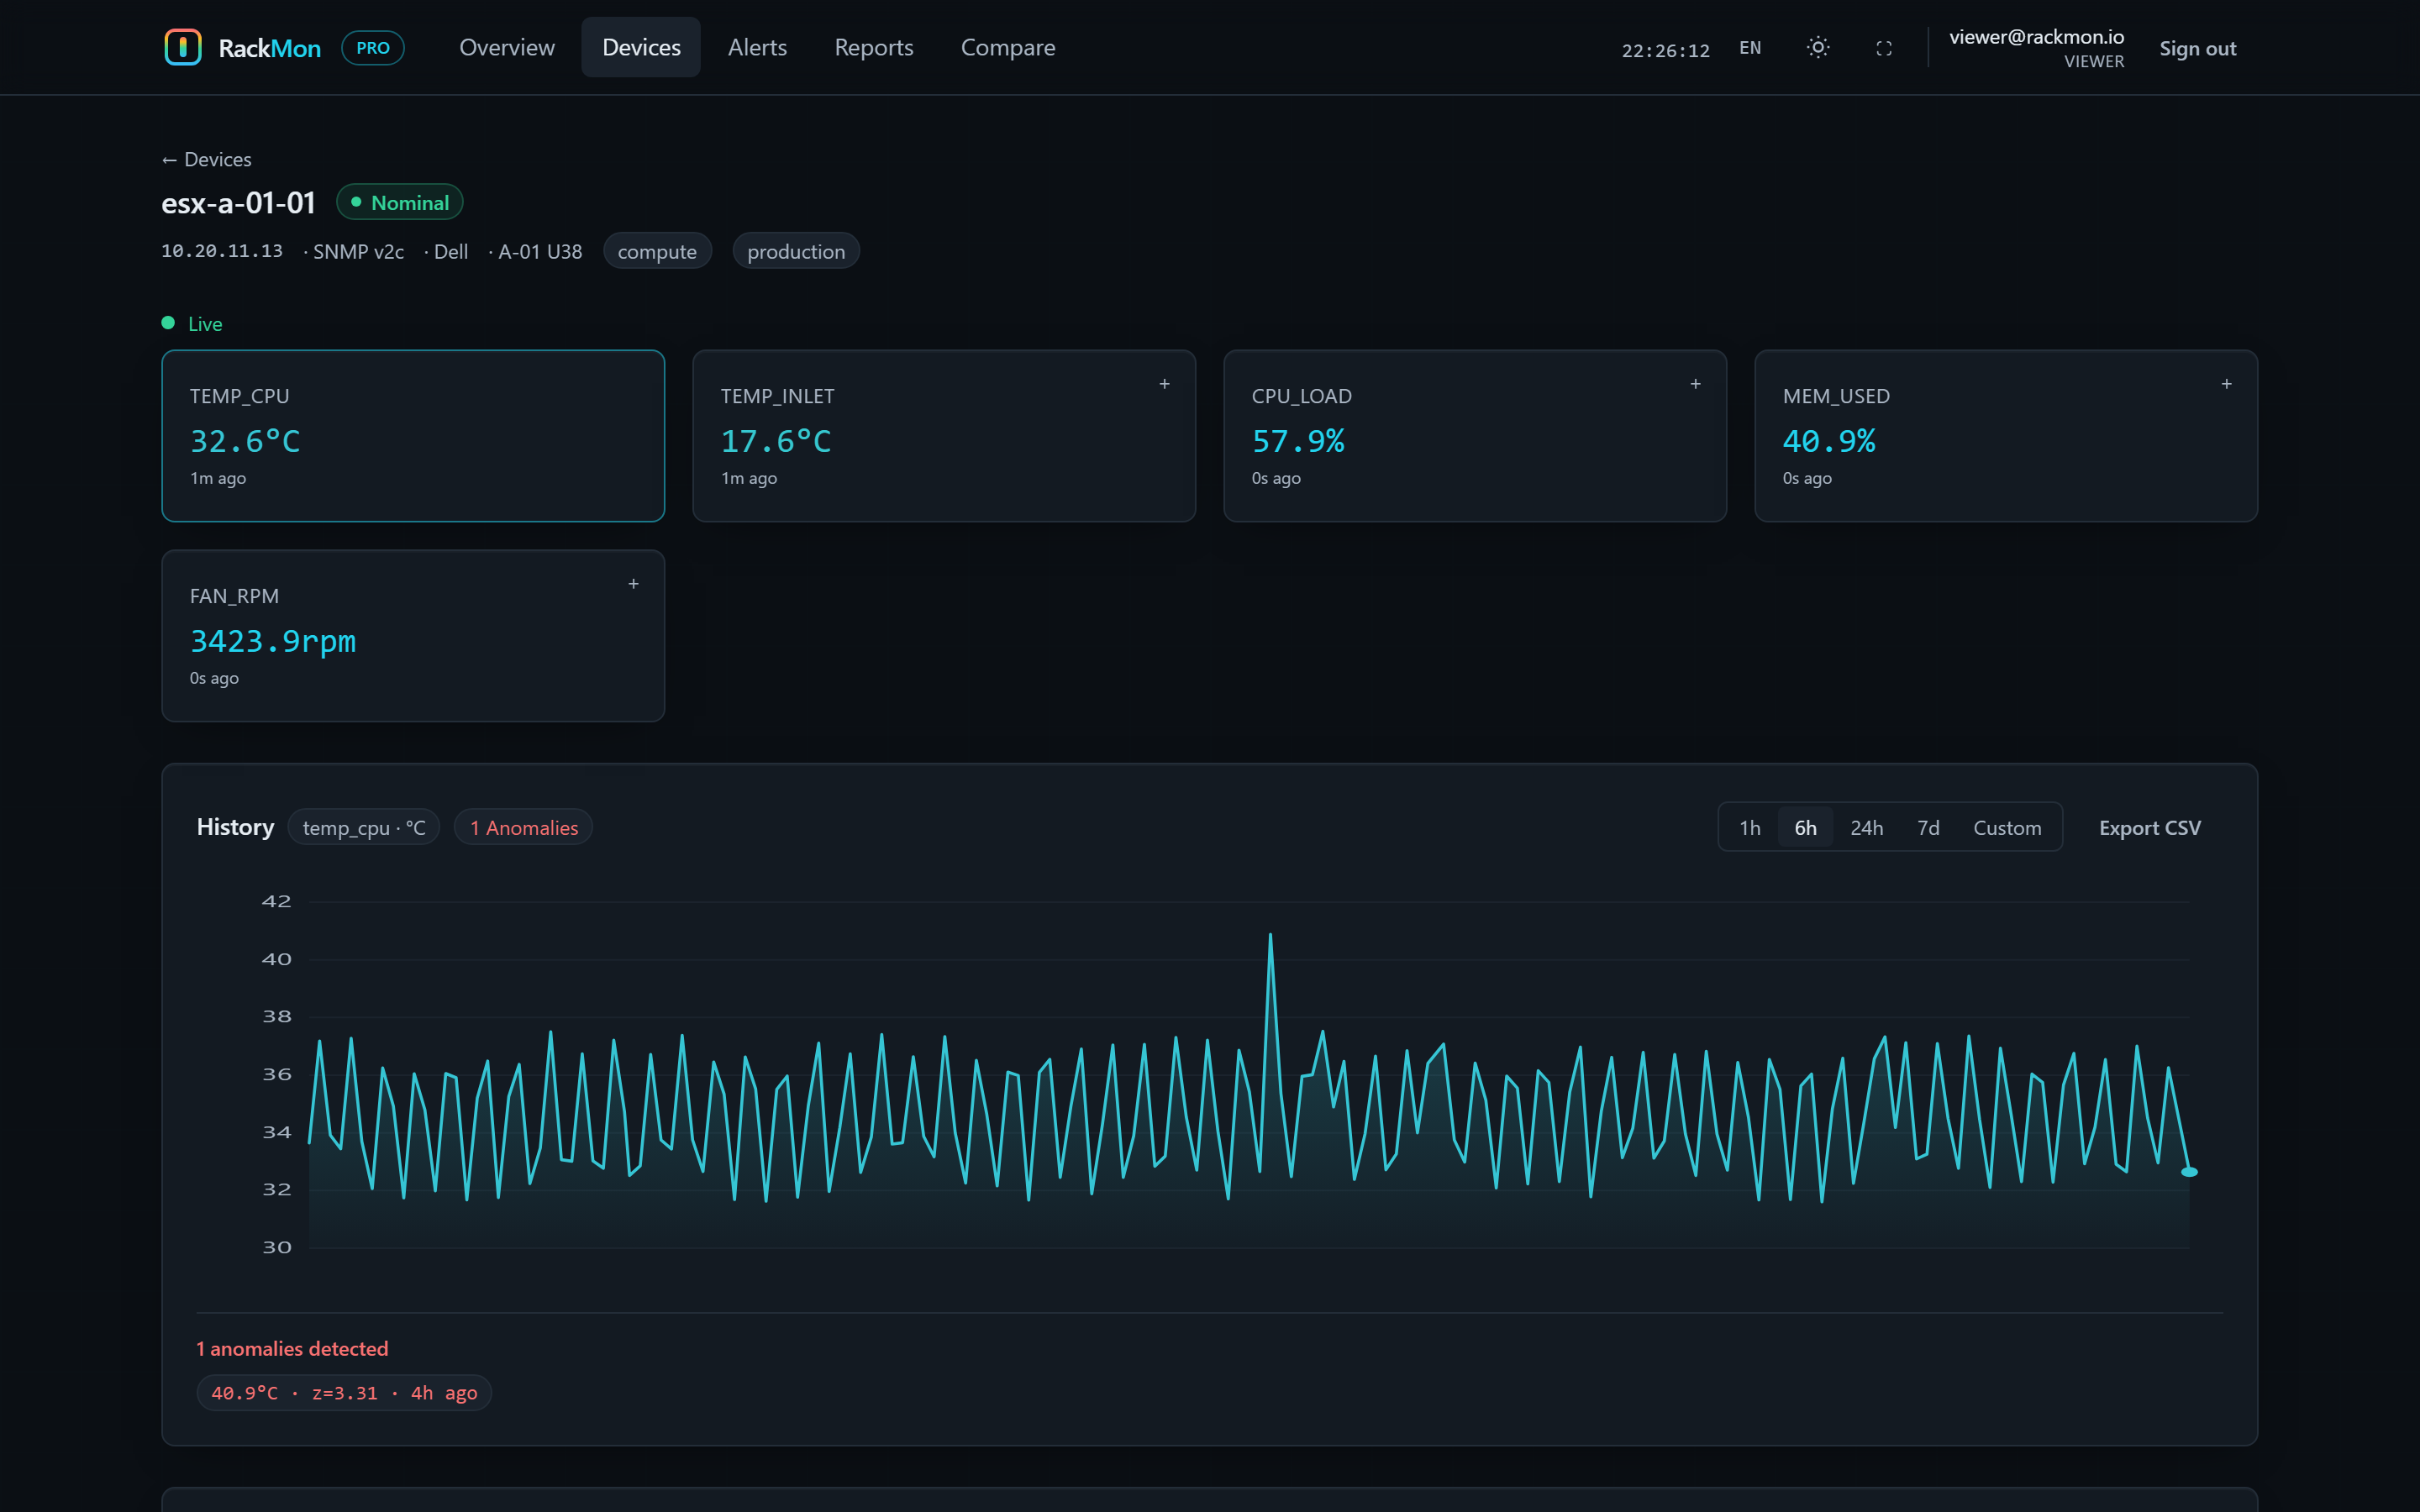
Open any device for live SNMP readings over WebSocket, history (30 days by default, configurable), anomaly detection and one-click CSV — temperature, CPU, fans and memory in one view.
- Live values, updating in real time
- Area charts: 1h / 6h / 24h / 7d
- Anomaly flags (z-score) on the timeline
Alerts that respect your team.
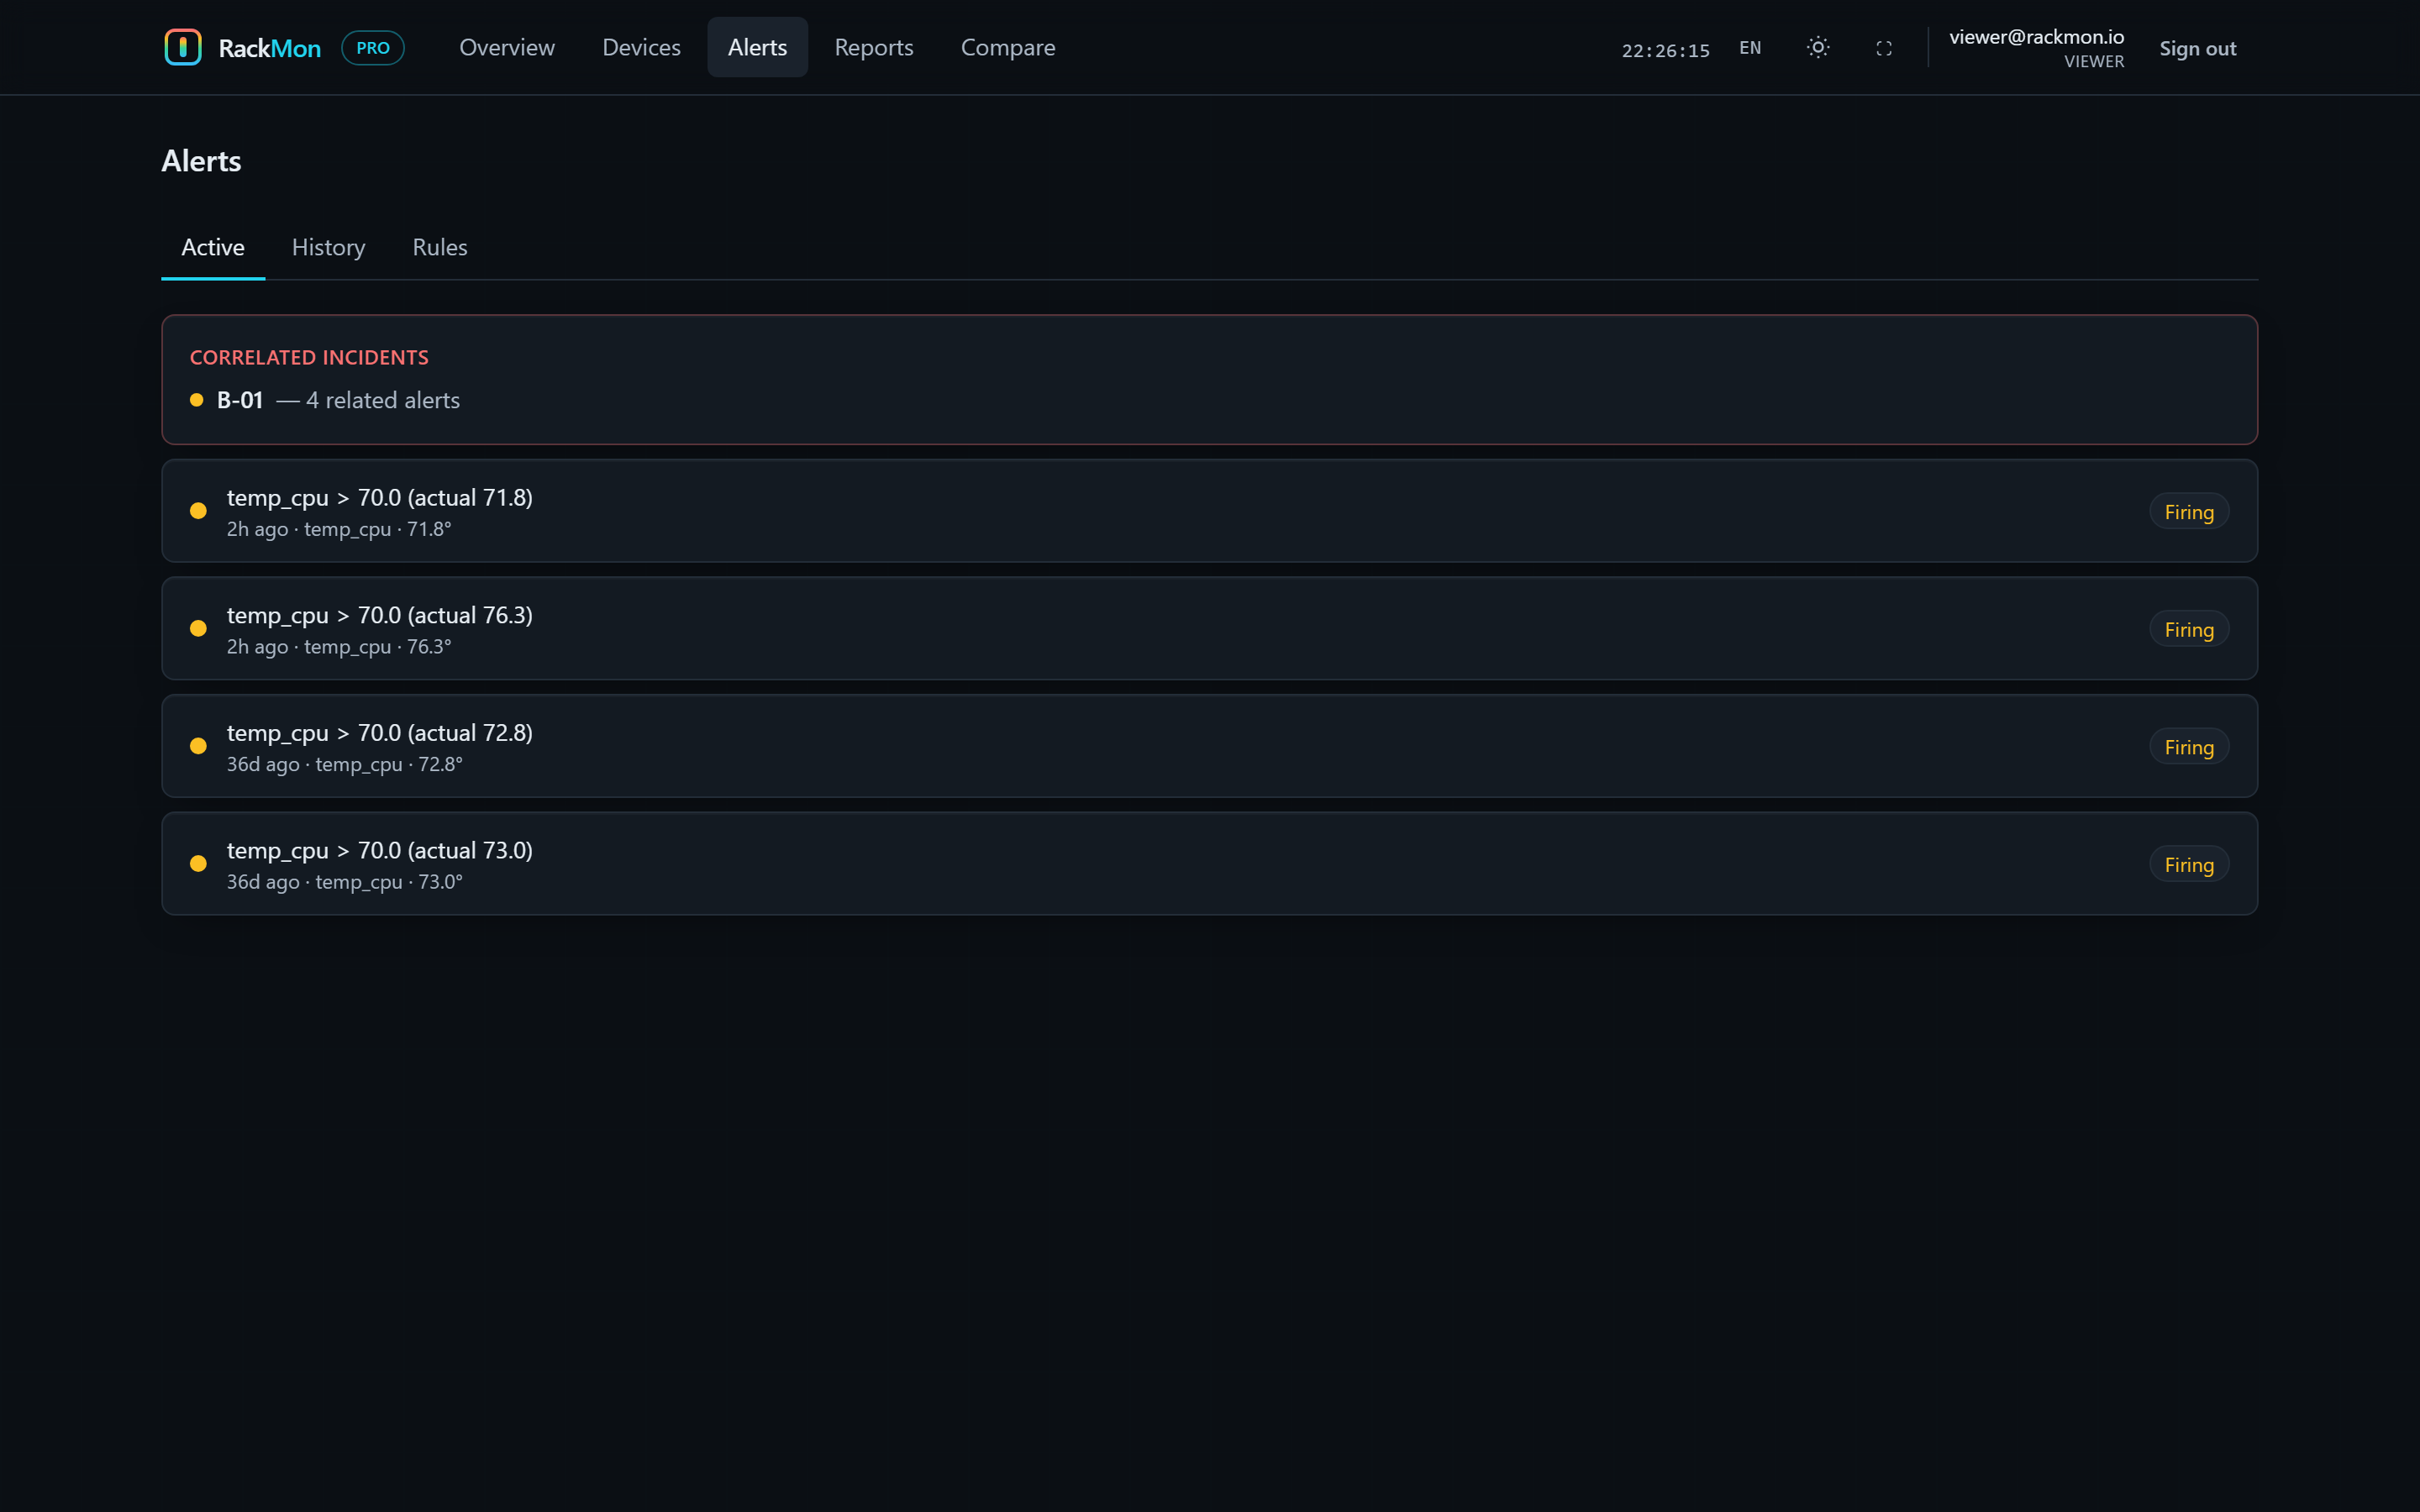
Rules with hold windows, dedup, snooze and escalation — grouped into correlated incidents by rack. A missing reading or a maintenance window never fakes an all-clear.
- Ack, snooze & resolve with an audit trail
- Email · Slack · Teams · webhook · Telegram
- Correlated incidents, not a wall of noise
Reports your clients will accept.
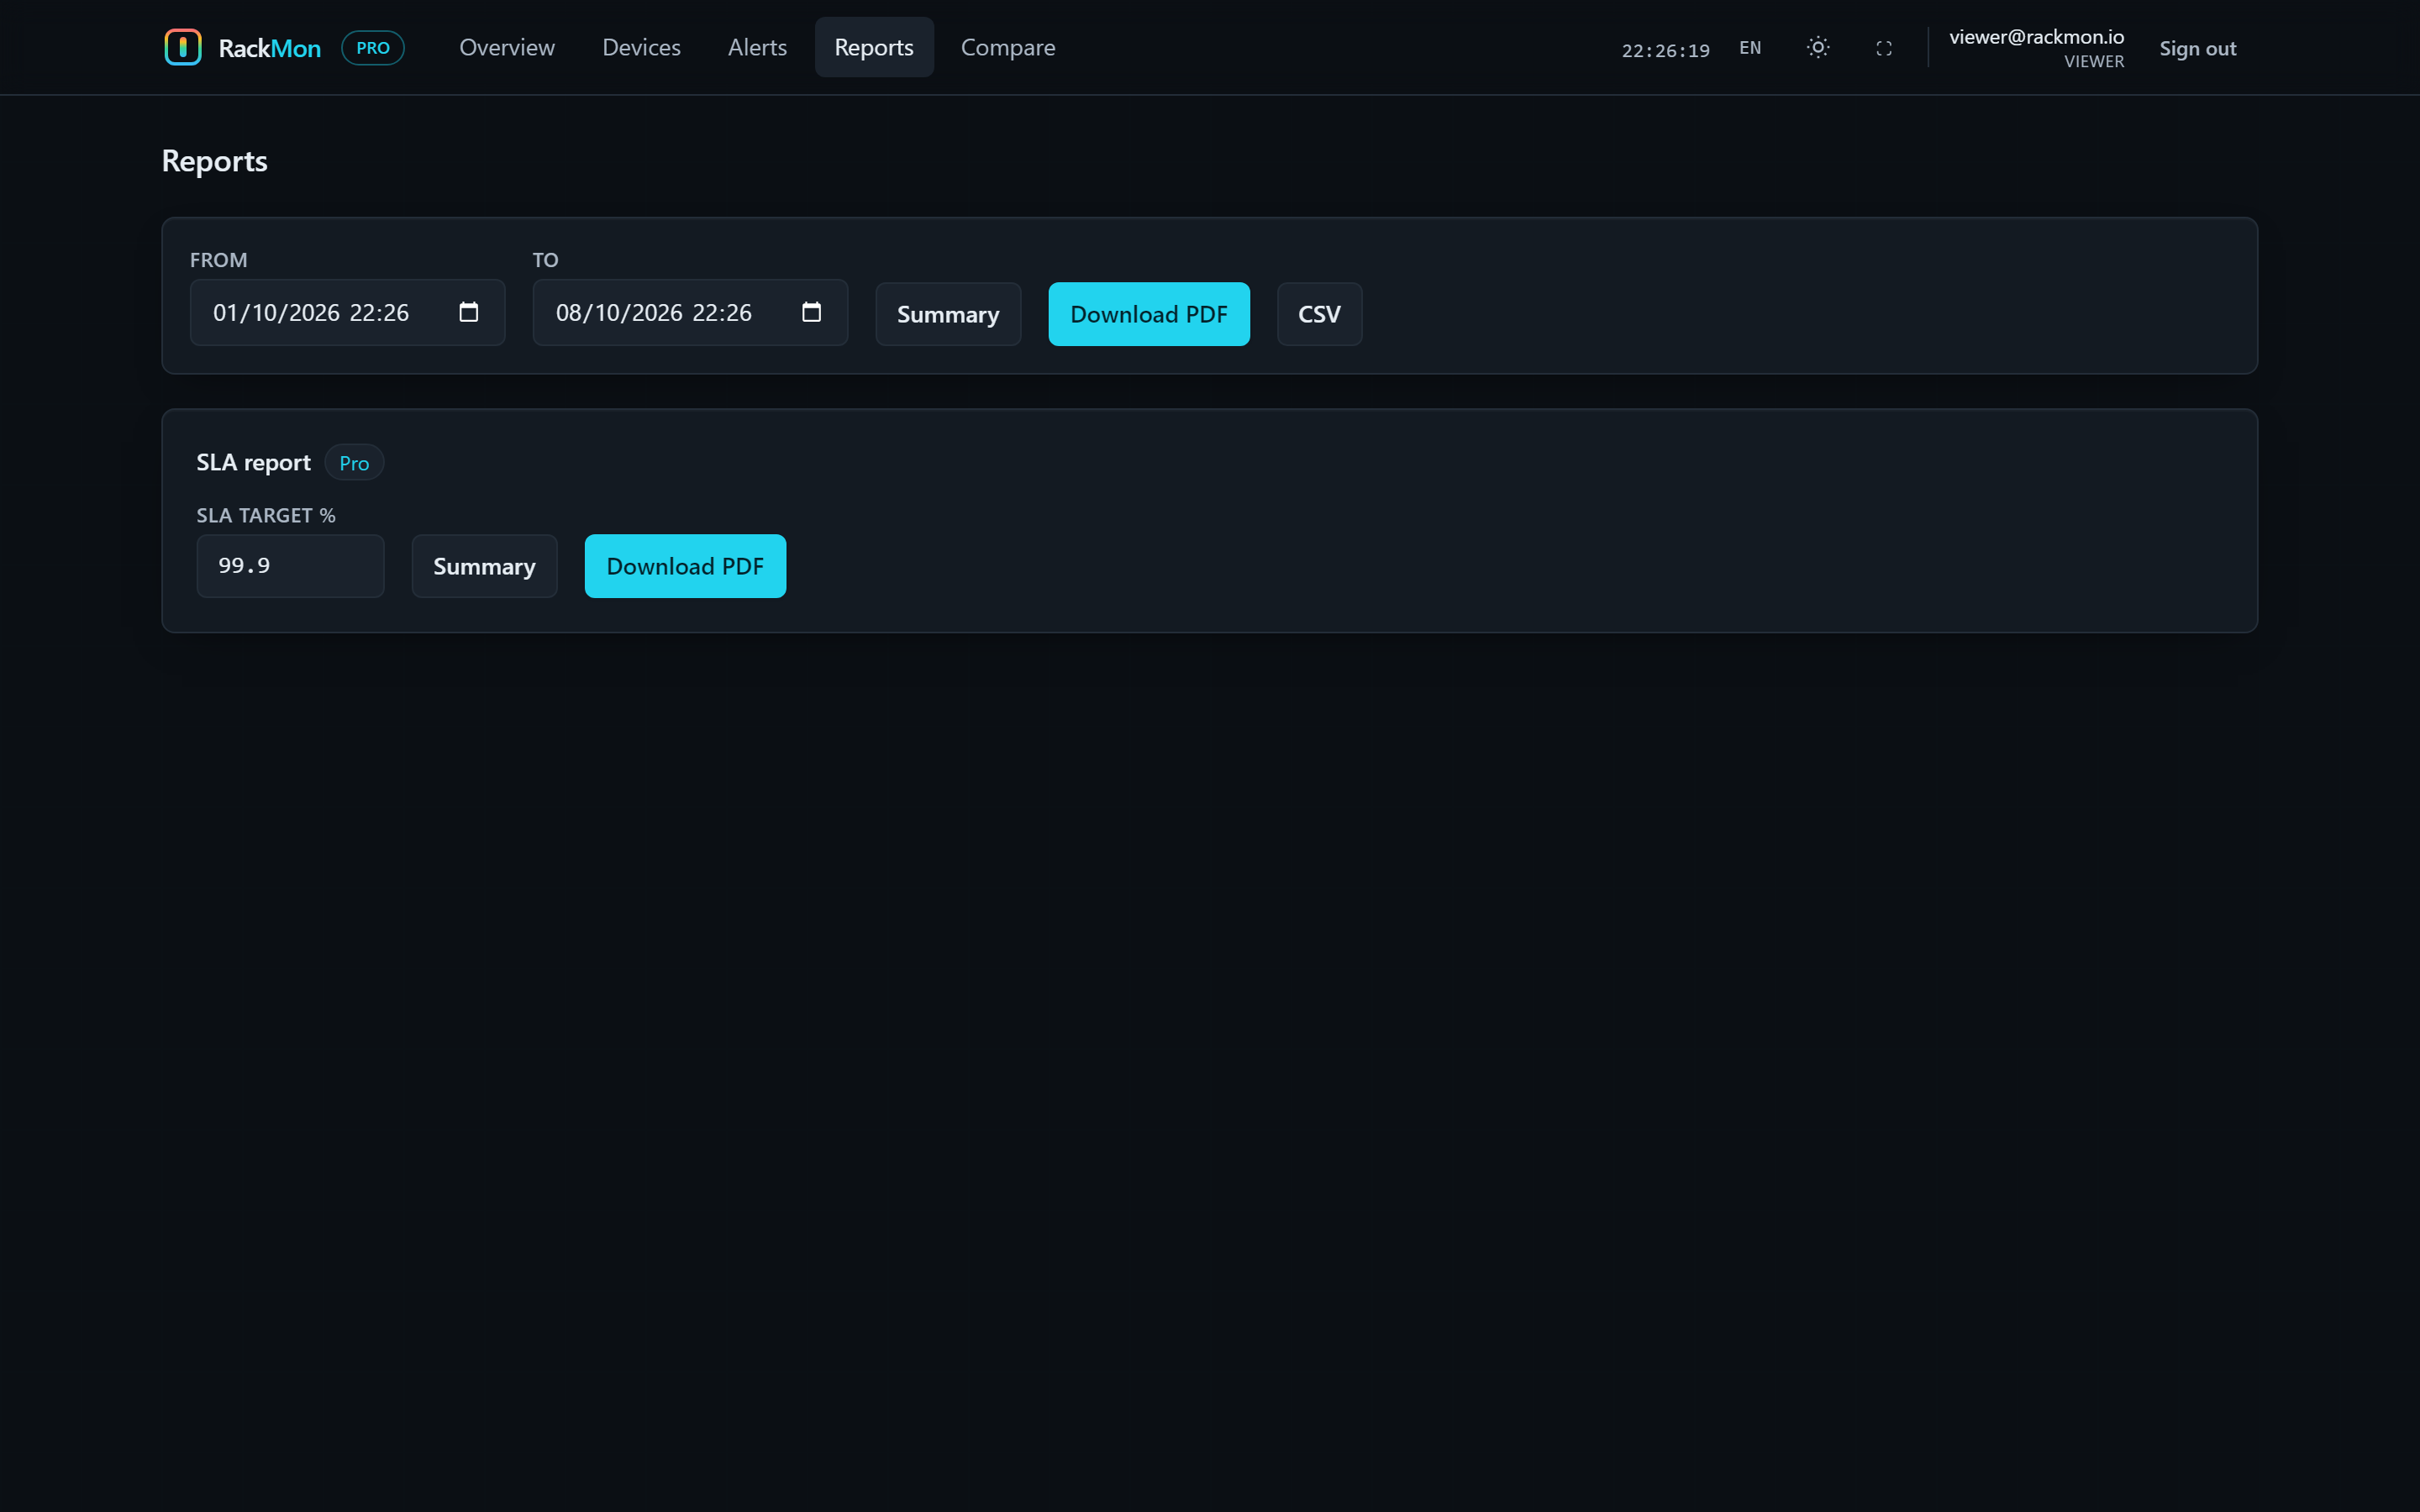
Availability, SLA compliance, MTTR and downtime per device — as a PDF. Plus a sanitized, public status page you can put in front of tenants.
- SLA report vs a target, PDF-ready
- Public read-only status board (no data leaks)
- White-label it: your name, logo & color
The monitor the big tools forgot to build.
Zabbix is too much to run. Enterprise DCIM is too much to buy. RackMon is the pragmatic middle.
Ten-minute setup
One container serves API and UI. SQLite to start, PostgreSQL / TimescaleDB when you grow.
Your data, your box
Fully self-hosted. No account, no phone-home. Secrets encrypted at rest.
Honest alerting
Hold windows, dedup, escalation — and it never turns a poll gap into a false recovery.
Client-ready
Public status page, SLA/uptime PDFs and white-label branding — for colo & MSPs.
Enterprise auth
SNMP v3, API keys, RBAC and a full audit log — with LDAP/AD and OIDC SSO on Pro.
Thermal-first
Purpose-built for heat: rack elevations, thermal palette, temperature at the center.
From a single edge box to a fleet of client racks.
Free to run. Pay when it earns its keep.
Open-core and self-hosted. The full monitor is free forever; Pro unlocks the client-facing features. Licensed per instance, verified offline — no license server.
Community
- Unlimited devices & metrics
- Rack heatmaps & live telemetry
- Alerting: email · Slack · webhook · Teams
- SNMP v2c/v3 · discovery · reports
- Self-host, your data, no phone-home
Pro
- Everything in Community
- SSO (OIDC) & LDAP / Active Directory
- Public status page
- SLA & availability reports (PDF)
- White-label branding
- Priority email support
Enterprise
- Everything in Pro
- Deployment & migration assistance
- Named contact, agreed response times
- SLA-backed support
- Volume & MSP licensing
Launch pricing, locked in for early customers. License keys are Ed25519-signed and verified offline — no license server, no call-home.
Running in about ten minutes.
One image serves the API and the web UI on port 8000.
Discovery finds SNMP hosts; the simulator gives you live data instantly.
Thresholds, hold windows and channels — email, Slack, webhook, Teams, Telegram.
Drop your key into RACKMON_LICENSE_KEY for status page, SLA reports & white-label.
Stop finding out from the smell of hot plastic.
Deploy RackMon Community free, and see every rack's temperature in the next ten minutes.